
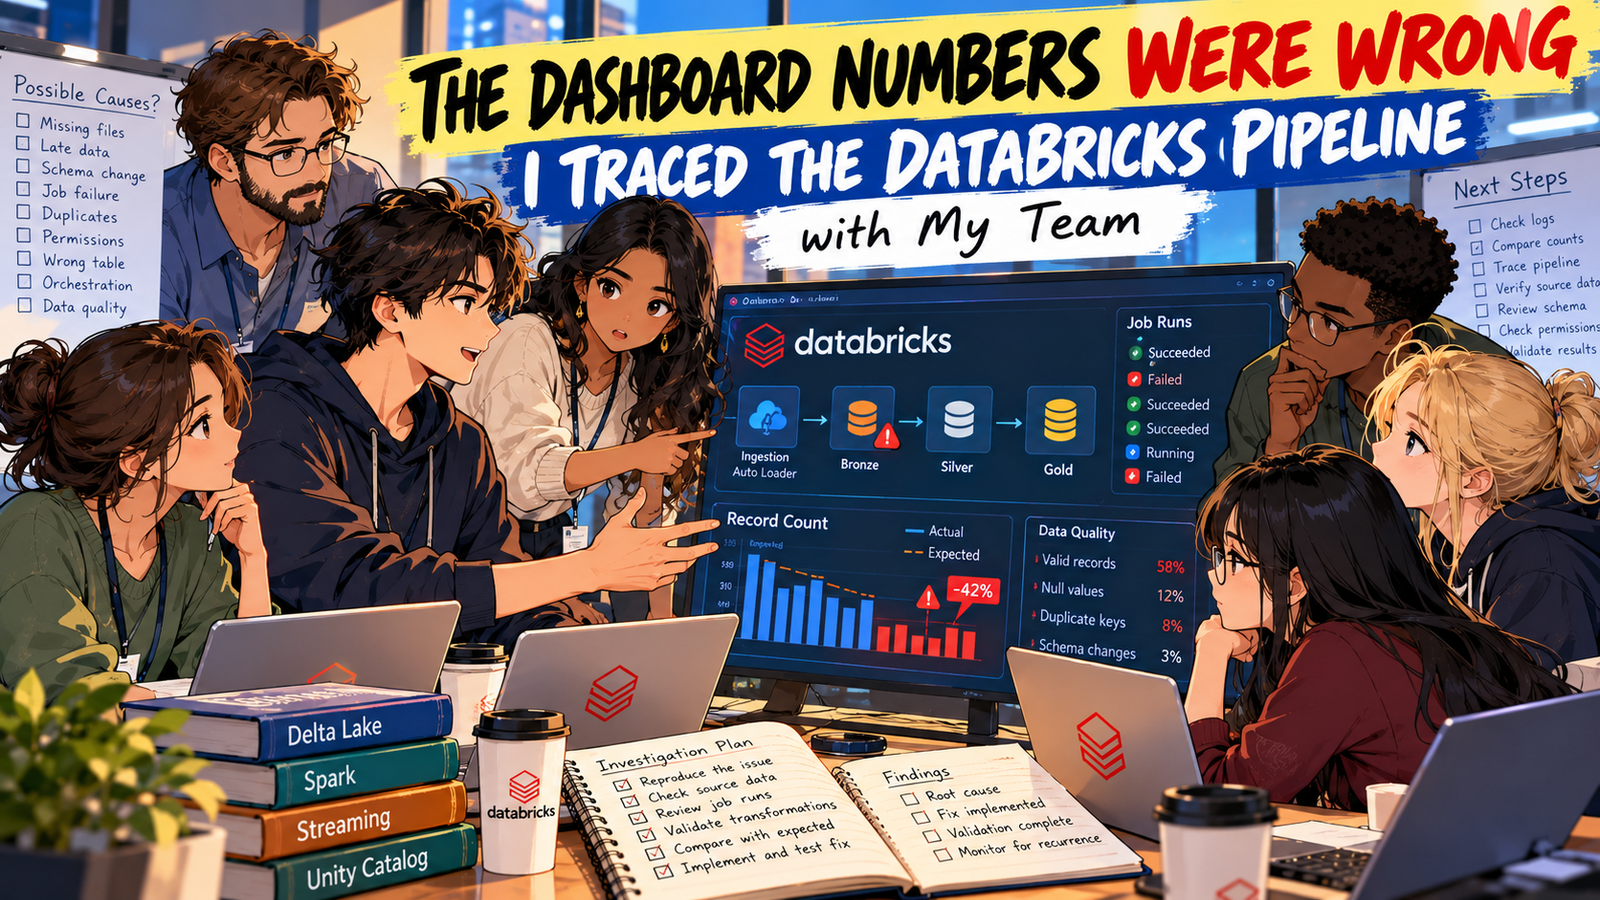
🚨 The Dashboard Numbers Were Wrong — I Traced the Databricks Pipeline with
My Team
My morning started with a message from Maya, one of our business
analysts: “The revenue dashboard is showing yesterday’s numbers.” A few
seconds later, Daniel from the product team added another problem. Several
orders visible in the operational application were missing from our
analytics tables. The Databricks jobs page looked mostly green, so at first
glance the platform seemed healthy.
I knew that “the dashboard is wrong” was not a root cause. It was only
the first symptom. I opened our pipeline with the rest of the team and
started tracing the data from its source to the final reporting layer.
Instead of immediately rerunning jobs, I wanted us to establish what had
actually happened.
I begin with the people who noticed the problem
I ask Maya exactly what she sees. She tells me that the dashboard
refreshed at its normal time, but the latest business date in several
visualizations is still yesterday. Daniel checks the order application and
confirms that customers placed new orders during the morning. That gives me
two useful facts: new business activity exists, and the reporting system
has not reflected all of it.
Priya, our platform engineer, joins the call. She checks the scheduled
workflow and notices that the Gold publishing task completed. That sounds
reassuring until I ask what data it actually read. A successful downstream
task can publish stale upstream data perfectly successfully.
This is why I try to keep incident conversations precise. When someone
says, “The job worked,” I ask which job, what input it used, and what
output it produced. A green status tells me about execution. It does not
automatically tell me that the business result is current or correct.
We trace the pipeline backward
Maya starts from the dashboard because that is where she observed the
problem. I start from the same place, but then I move backward. I check the
Gold table feeding the dashboard. Its latest records are old. I compare the
corresponding Silver table and discover that it is also behind. Then I
inspect Bronze.
Bronze contains some new records, but not all of the files we expected.
Now the investigation has changed. Instead of focusing on dashboard SQL, I
have evidence that the freshness problem exists much earlier in the
pipeline.
Leo, the ingestion engineer, checks cloud storage. The missing files are
present. Their timestamps show that they arrived before the ingestion job
completed. That gives us a much stronger question: why did our incremental
ingestion process fail to include files that were already available?
We investigate ingestion without destroying evidence
Leo asks whether we should clear state and restart everything. I resist
that suggestion until we understand the existing state. Resetting
checkpoints or changing source tracking during an investigation can remove
useful evidence and alter the behavior we are trying to diagnose.
We inspect the ingestion configuration, recent runs, source path, schema
behavior, and the state used by the incremental process. We compare what
the job believed it had processed with what actually existed in storage.
The conversation matters here because each person sees a different
boundary. Leo understands the file producer. Priya understands the
Databricks runtime and job configuration. I understand the downstream
transformations. Maya understands what the business expected to see. No
single person has the complete incident in their head.
A second problem appears: duplicate orders
While we are investigating freshness, Maya finds something else. A small
set of orders appears twice in a Silver table. Now we have to avoid
assuming that the duplicate records and missing files share the same
cause.
Daniel gives us the order identifiers. I trace them backward and
discover that the corresponding input was processed around the time of a
failed run and retry. The ingestion issue explains missing data, but the
duplicate issue may involve replay behavior.
I ask whether the transformation is idempotent. If the same business
event is encountered again after a retry, does the write produce the same
intended final state, or does it create an additional business effect? That
question moves the investigation from ingestion into write semantics.
Stable keys give us something to reason about
The source provides an order identifier, but I still need to understand
what each record represents. Is every record a completely new order? Can an
existing order change status? Can the source resend an earlier state? Can
an order be cancelled?
Daniel explains that the operational system can update orders after
creation. That means blindly appending every incoming record may not
represent the intended current state. I discuss a key-based update strategy
with the team and examine whether MERGE conditions match the business
semantics.
For change-oriented feeds, I also care about sequencing. Two changes for
the same order can arrive close together. If I apply them in the wrong
logical order, the table can end with an older state even though the newest
change was present in the input.
Our streaming team joins the call
Another engineer, Sofia, notices that a separate near-real-time metrics
stream has been consuming more state than usual. Her workload groups events
by event time, and some events arrive late because a mobile client can
remain offline before synchronizing.
This is a different investigation again. I do not want to use the
ingestion fix for a streaming-state problem. Sofia and I discuss the
accepted lateness of the business process and how long the query needs to
retain relevant state. We inspect the event-time behavior and the watermark
design rather than simply increasing resources.
The business requirement matters. If legitimate events routinely arrive
thirty minutes late, a policy designed around a few seconds of lateness may
produce technically efficient but incorrect business results. Configuration
should follow the real data contract.
Maya challenges our definition of “correct”
Maya asks a useful question: “If every job turns green after we fix
this, how do we know the numbers are actually right?”
That question shifts the discussion toward data quality. We identify
invariants we can test. Order identifiers expected to be present should not
be null. Certain keys should satisfy uniqueness expectations at the
appropriate layer. Revenue totals should reconcile within the rules defined
by the business. Required relationships should hold before data is
published.
I like this part of the incident because it reminds me that monitoring
execution alone is not enough. A job can execute exactly as written and
still implement the wrong assumption.
We find an orchestration weakness
Priya reviews the workflow graph and discovers that one publishing task
is scheduled independently instead of depending explicitly on the
completion of its upstream validation task. Most days the timing works
because validation finishes quickly. On a slower day, publishing can begin
too early.
This explains why the system can occasionally expose stale or
unvalidated data without any individual task necessarily failing. The
transformation code is not the problem. The dependency model is.
We replace timing assumptions with an explicit relationship. If
publication requires successful validation, the workflow should represent
that requirement directly.
The security engineer finds another issue
Amira from security joins because the incident review includes
production access. While checking Unity Catalog permissions, she discovers
that an analyst group has broader modification privileges than its
reporting responsibilities require.
This did not cause the freshness incident, but it is still a production
risk worth correcting. We separate it from the root-cause analysis so that
our incident timeline remains accurate. Then we review the privileges
according to least-privilege principles.
I find this distinction important. During a large investigation, teams
often discover unrelated weaknesses. They should be addressed, but not
every discovered weakness should be retroactively labeled as the cause of
the original incident.
We compare development and production
One remaining behavior is difficult to reproduce. A pipeline works in
development but behaves differently in production. Rather than assuming the
source code must be different, Priya and I compare the deployed
configuration.
We review environment-specific parameters, resource definitions,
permissions, runtime settings, and deployment history. A reproducible
deployment process gives us something concrete to compare. When
infrastructure and Databricks resources are represented as
version-controlled definitions, I can inspect changes instead of relying on
someone’s memory of a manual configuration.
We build a shared incident timeline
By this point, the call includes people from analytics, product,
ingestion, platform, streaming, security, and data engineering. To prevent
the investigation from turning into disconnected theories, I build a
timeline.
I record when source files arrived, when ingestion ran, when the failed
attempt occurred, when the retry happened, when validation completed, when
publication started, and when the dashboard refreshed. I attach evidence to
each point rather than opinions.
The timeline helps us see that we are not dealing with one magical
failure. We have an ingestion freshness issue, replay-sensitive duplicate
behavior, an orchestration weakness, and an unrelated privilege problem
discovered during review. Each requires a different owner and
remediation.
How I communicate during the incident
I try to use language that makes uncertainty visible. I say, “The
evidence currently points to the ingestion boundary,” instead of, “Auto
Loader is broken.” I say, “We have confirmed duplicate effects after a
retry,” instead of, “Spark duplicated the data.” The first phrasing tells
the team what we know. The second can accidentally turn an untested
explanation into a fact.
I also repeat important conclusions back to the team. Maya confirms the
business impact. Leo confirms which files were missed. Sofia confirms the
streaming behavior. Priya confirms the workflow and deployment state. Amira
confirms the permission finding. Shared understanding is part of incident
response.
Recovery is not the end of the investigation
After the immediate pipeline is repaired, I verify the system from end
to end. I confirm that the previously missing source data has been
processed, duplicate business effects have been addressed according to the
intended model, Silver and Gold are current, validation completes before
publication, and the dashboard reflects the expected reporting period.
Then I ask what will prevent recurrence. Do we need stronger freshness
monitoring? Should retries be tested explicitly? Do we need a data-quality
gate before publication? Should workflow dependencies be reviewed
automatically? Can deployment drift be detected earlier? Should access
reviews be scheduled?
The incident becomes valuable when it improves the system, not merely
when the alert disappears.
What I learned from working with different people
The strongest investigations are conversational because production
systems cross team boundaries. The analyst sees the business symptom. The
product owner understands expected behavior. The ingestion engineer knows
the source. The platform engineer sees execution and deployment. The
security engineer understands access. The streaming engineer understands
state and event time. I connect those perspectives through the data
pipeline.
The scenarios below follow the same pattern. I am not alone in a
notebook choosing isolated features. I am talking with different people,
asking questions, challenging assumptions, examining evidence, and deciding
what to investigate next. The conversations become more complex as the
incidents involve more systems and more competing explanations.
Note: This is an independent educational scenario created for
Databricks data-engineering practice. The people and incident are
fictional. Product names are used descriptively, and the scenarios do not
reproduce certification exam questions.


Leave a Reply